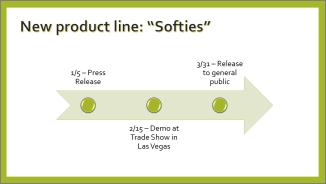
If you want to create a graphical representation of a sequence of events, such as the milestones in a project or the main events of a person's life, you can use a SmartArt graphic timeline. After you create the timeline, you can add more dates, move dates, change layouts and colors, and apply different styles.
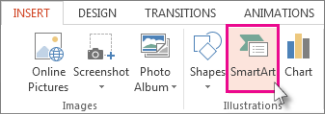
On the Insert tab, click SmartArt.
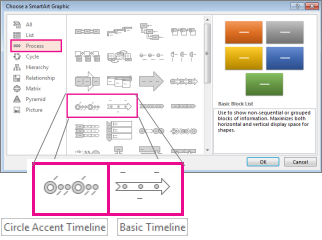
In the Choose a SmartArt Graphic gallery, click Process, and then double-click a timeline layout.
Tip: There are two timeline SmartArt graphics: Basic timeline and Circle Accent Timeline, but you can also use almost any process-related SmartArt graphic.
Click [Text], and then type or paste your text in the SmartArt graphic.
Note: You can also open the Text Pane and type your text there. If you do not see the Text Pane, on the SmartArt ToolsDesign tab, click Text Pane.